
WATER UTILITIES AND MUNICIPALITIES

A meter investment is an operating decision, not a metrology purchase

Smart metering affects non-revenue water investigation, customer service, field planning and crisis management at the same time. This page frames the investment through those four topics.

CONTEXT IN TÜRKİYE

Official targets ask for measurable improvement

The Water Efficiency Strategy Document and Action Plan sets dated water-loss targets for municipalities. Meeting them depends on seeing what happens in the network earlier and in more detail.

0%

Average drinking-water loss in Türkiye (2021)

Source: Water Efficiency Strategy Document and Action Plan, Ministry of Agriculture and Forestry

0%

Non-revenue water rate (2021)

Source: Water Efficiency Strategy Document and Action Plan

0%

2028 water-loss ceiling for metropolitan and provincial municipalities

National target; the 2040 target is 10 percent.

These figures are national averages and do not describe any single utility. The local baseline should be established through the utility's own water balance study.

USE CASES

Who uses the data, and for which decision

The scenarios below concern different teams. The same data answers different questions.

Non-revenue water investigation

Compared against zone inlet measurement, customer meter data shows where the gap concentrates. The field team then surveys the priority zone rather than the whole network. Combined with a DMA approach, the result is sharper still.
Data used
Hourly consumption, continuous flow duration, minimum night flow
Owning team
Non-revenue water and network operations

Billing accuracy and customer disputes

When index and consumption profile are stored together, a dispute is answered with a record rather than an estimate. High bills caused by leaks inside the property are noticed early.

Data used
Index, period consumption, continuous flow alert
Owning team
Customer services and the call centre

Field operations planning

Device health data turns battery replacement, weak signal and faulty valves into planned work. Visits are batched by zone instead of handled one by one.

Data used
Battery level, signal quality, restart counter, valve error code
Owning team
Meter operations and field crews

Drought and crisis management

During restrictions, consumption trends can be followed by zone and the effect of policy-driven throttling decisions can be measured. Graduated throttling instead of a full shut-off is an option that reduces social impact.

Data used
Zonal consumption trend, valve state and command result
Owning team
Executive management and crisis response

END USERS

What changes for the customer

Smart metering does not only make the utility's work easier. Set up properly, it has concrete benefits for the customer too.

01

Fewer estimated bills

Because the index is read remotely, estimated bills caused by nobody being home — and the corrections that follow — become rarer.

02

Early leak warning

When continuous flow inside the property is detected early, the customer can act before facing a large bill.

03

Disputes answered with records

Because the consumption profile is retained, a dispute is assessed against timestamped records rather than an estimate.

04

Throttling instead of shut-off

Where policy allows, graduated throttling rather than a full shut-off can preserve access to basic water supply.

Detailed consumption data can carry information about household behaviour. What is collected, how long it is kept and who can access it must therefore be communicated clearly to customers, and data minimisation must be part of the design.

OUTCOMES TO MEASURE

Not promises — items to measure in the pilot

The items below are not a performance guarantee; they are indicators to be measured together during the pilot programme. Target values are set by the utility and the product team at the start of the project.

KPI 01

Read success rate

How many of the expected daily and weekly packets arrive on time, reported separately by coverage class.

KPI 02

Reduction in field visits

The number of planned visits removed because configuration and firmware work can be done remotely.

KPI 03

Alarm-to-action time

The time between an event occurring on the device and the field team acting on it.

KPI 04

Data completeness and latency

Missing and duplicate packet rates, together with P50/P95 data latency.

KPI 05

Firmware rollout success

The share of devices completing an update in one rollout and the number needing a field visit.

KPI 06

Integration time

The working days needed before data starts flowing into the utility's HES/MDM, SCADA or GIS system.

No target figure is published on this site for these items. The measurement method is defined in writing before the pilot so that a comparable baseline exists.

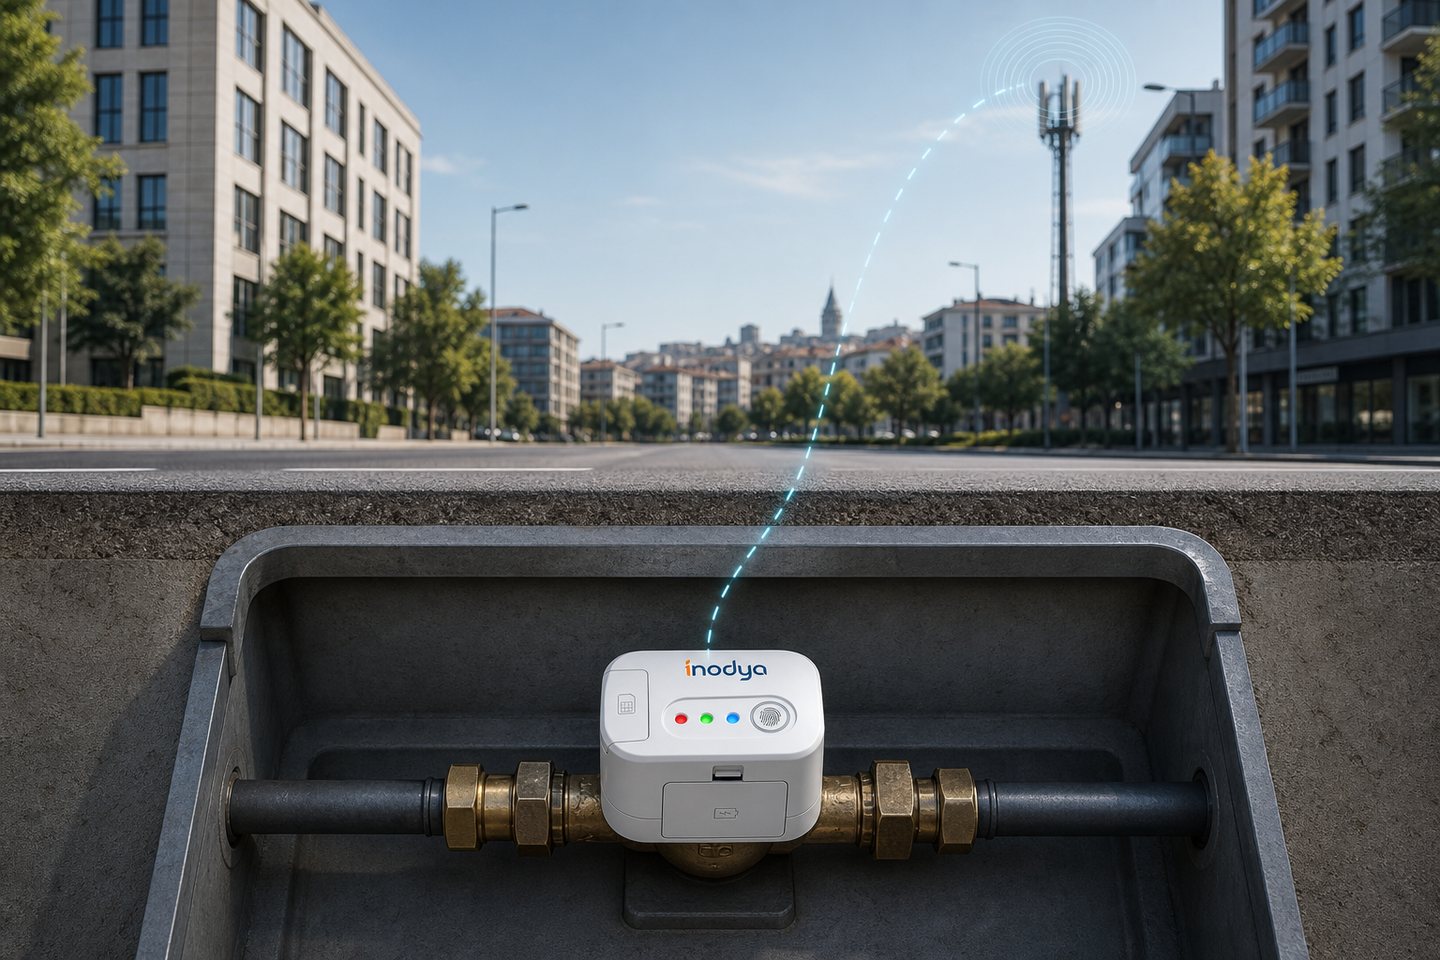
A smart water meter installed in a meter chamber beneath a city street.

NEXT STEP

Start by measuring in your own network

Let us validate the coverage, data, battery and integration assumptions together in a limited pilot. We write the success criteria before the pilot begins.